Kundencenter Server Traffic Graph/en
Aus EUserv Wiki
(Die Seite wurde neu angelegt: „{{Languages|Kundencenter_Server_Traffic_Graph}} '''''Use the Traffic Graph''''' __TOC__ <div style= "font-size: 1.571em;"> '''Using the Traffic Graph''' </div> ==…“) |
|||
| (Der Versionsvergleich bezieht 8 dazwischenliegende Versionen mit ein.) | |||
| Zeile 1: | Zeile 1: | ||
{{Languages|Kundencenter_Server_Traffic_Graph}} | {{Languages|Kundencenter_Server_Traffic_Graph}} | ||
| - | '''''Use the | + | [[Kategorie:Customer center Servers]] |
| + | [[Kategorie:Servers]] | ||
| + | '''''Use the traffic graph''''' | ||
__TOC__ | __TOC__ | ||
<div style= "font-size: 1.571em;"> | <div style= "font-size: 1.571em;"> | ||
| - | ''' | + | '''Use the traffic graph''' |
</div> | </div> | ||
== General== | == General== | ||
| - | If you have an EUserv server, | + | If you have an EUserv server plan, there is a possibility to comprehensively configure it in the customer service center. |
| - | You also need special parameters that you can find in the customer service center. | + | You also need special parameters that you can find in the customer service center, too. |
The traffic graph is a graphical way to represent and analyze your incoming and outgoing traffic. | The traffic graph is a graphical way to represent and analyze your incoming and outgoing traffic. | ||
| - | == | + | == Use the traffic graph == |
| - | In | + | In the customer service center, you have the possibility to display different traffic graphs for your server. |
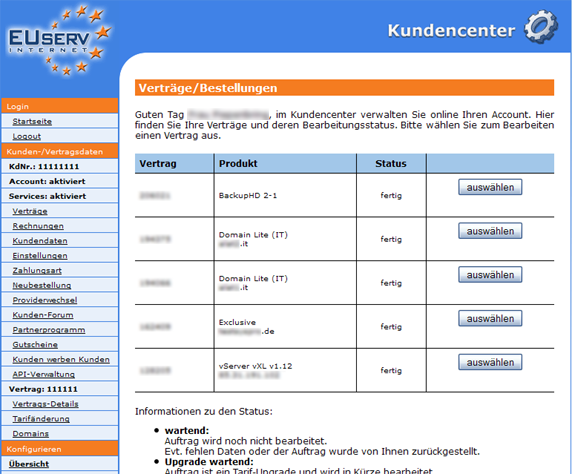
Choose your server contract for which you want to display the traffic graph. | Choose your server contract for which you want to display the traffic graph. | ||
| Zeile 24: | Zeile 26: | ||
<br> | <br> | ||
<br> | <br> | ||
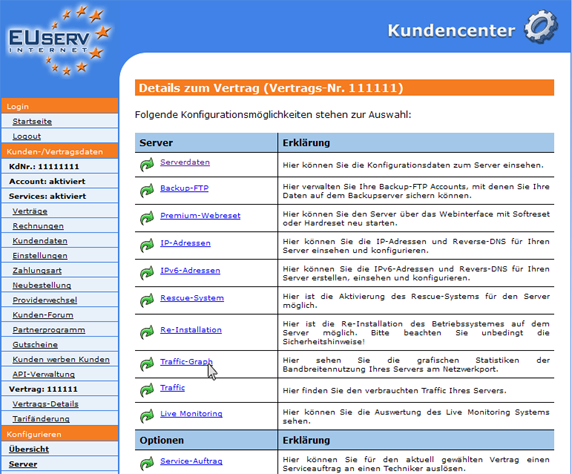
| - | Once you have selected your contract, | + | Once you have selected your contract, click on "Traffic-Graph". |
<br> | <br> | ||
<br> | <br> | ||
| Zeile 40: | Zeile 42: | ||
<br> | <br> | ||
<br> | <br> | ||
| - | If you want to | + | If you want to display only a particular graph, select it by using the drop-down menu. |
<br> | <br> | ||
<br> | <br> | ||
| Zeile 48: | Zeile 50: | ||
<br> | <br> | ||
<br> | <br> | ||
| - | If you have selected a graph in the drop-down menu, only this is | + | If you have selected a graph in the drop-down menu, only this is shown. |
<br> | <br> | ||
<br> | <br> | ||
| Zeile 56: | Zeile 58: | ||
<br> | <br> | ||
<br> | <br> | ||
| - | If you want to | + | If you want to display all the graphs again, select "Alle" in the drop-down menu. |
Aktuelle Version vom 15:53, 19. Okt. 2012
| | Languages: |
Deutsch |
Use the traffic graph
Inhaltsverzeichnis |
Use the traffic graph
General
If you have an EUserv server plan, there is a possibility to comprehensively configure it in the customer service center.
You also need special parameters that you can find in the customer service center, too.
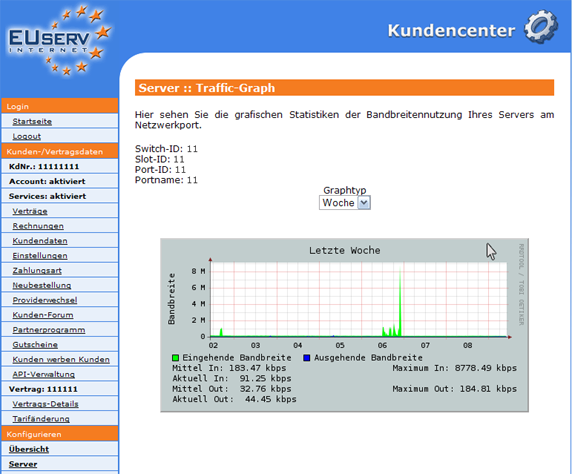
The traffic graph is a graphical way to represent and analyze your incoming and outgoing traffic.
Use the traffic graph
In the customer service center, you have the possibility to display different traffic graphs for your server.
Choose your server contract for which you want to display the traffic graph.
Once you have selected your contract, click on "Traffic-Graph".
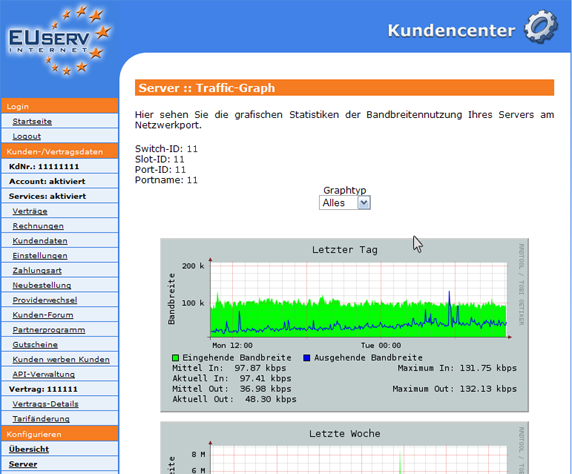
Here you will see all the traffic graphs that are available to you, one below the other.
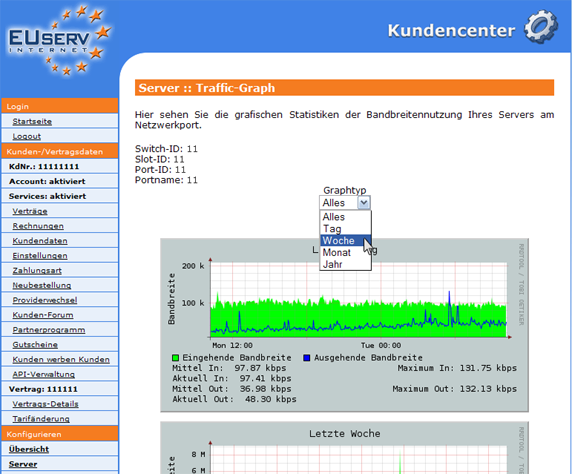
If you want to display only a particular graph, select it by using the drop-down menu.
If you have selected a graph in the drop-down menu, only this is shown.
If you want to display all the graphs again, select "Alle" in the drop-down menu.

